The past several years, we have been making efforts to “green up” our business, working with a sustainability partner to take a hard look at our operations and help us take steps to reduce our carbon footprint. In addition to developing a number of waste reduction programs, including recycling and composting, we continue to reduce our overall spend on resources and increase our green purchasing. We are using less paper — which means we are printing less — and we’re appealing to our providers, enrollees and employees to join us increasing the sustainability of how we do business. This includes the promotion and adoption of paperless benefit statements.
I invite you to take a look at our Environmental Sustainability Report and see the progress we’ve made over the past few years. And of course, comments and suggestions are welcome — please send them to GoingGreen@delta.org. Thank you for helping our efforts to be leaner and greener!
Employee and facility programs significantly reduce waste sent to landfills.
Read MoreOur teams are involved every day: composting, extended recycling and employee-led initiatives all help us make a difference.
Read MoreBuildings recognized for a focus on sustainability make us proud to come to work.
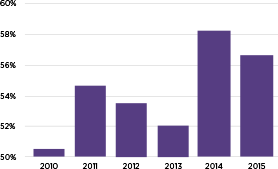
Read MoreWe committed to reducing the amount of trash sent to landfills and implemented better tracking to measure our progress. We continue to redirect more than 50% of our waste into reuse or recycling program.
Percentage of waste diverted
Our convenient online tools plus enrollees and dentists opting out of paper mailings helped us reduce our environmental footprint. We are ramping up our paperless adoption efforts in 2016.
15.7 million mailings suppressed
= 5,649 trees saved*
*Courtesy of Environmental Paper Network
Adult enrollees are transitioning to online-only account management. This is a large opportunity for us to pioneer this effort in a historically paper-heavy industry. We need your help! Sign up to go paperless.
%
Enrolled
Tons Recycled
Polystyrene/Foam
Tons Reused
Cooking Oil
Tons Recycled
Electronics
Tons Collected
Compost
Innovative recycling programs allow us to keep more than half of our waste out of landfills. An employee-led polystyrene/foam initiative, a regional biodiesel program, an electronics-specific recycling bin and in-office composting are reasons for our success. We are proud to partner with local experts who are taking bold steps to reduce landfill volume.
Over the last five years, we have made a concerted effort toward reducing our overall consumption of supplies while simultaneously working to increase the proportion of green products we use in all of our facilities.
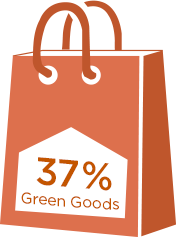
Purchasing of total goods down
15%

We have 10 facilities with at least 35 employees. Six buildings are ENERGY STAR certified, and four of those achieved LEED certification. We are working to bring the entire portfolio up to these highly respected standards.
Two of our largest facilities offer charging stations for employees’ electric vehicles.
2,767 gallons of gasoline saved
Efficiency initiatives in our largest data center, a facility type that is universally infamous for high usage, achieved meaningful results quickly.
We measured a 5.5% reduction in electricity consumption in one facility, which is equivalent to 74,737 clothes dryer loads.
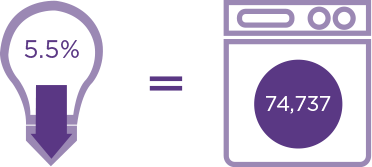
Electricity Reduction
Clothes Dryer Loads
EPA’s WasteWise encourages organizations and businesses to achieve sustainability in their practices and reduce select industrial wastes. WasteWise is part of EPA’s sustainable materials management efforts, which promote the use and reuse of materials more productively over their entire lifecycles. We have completed all program and reporting requirements to achieve partner status.
Disclaimer: Use of this logo does not imply EPA endorsement.
California’s Green Business Certified program recognizes environmental sustainability programs that include purchasing policy, cleaning protocol and onsite assessments. Currently, our Rancho Cordova, CA location is Green Business Certified; our goal is to bring more facilities into this program.
The Outstanding Building of the Year® (TOBY) Awards honor the best of the best in commercial buildings. Our Alpharetta, GA, facility won local and regional TOBY Awards.
In 2015, we took a bold new step and began purchasing RECs through the Sacramento Municipal Utilities District with a goal of further reducing our GHG emissions from electricity generation.
4 of 10 buildings are in this program
50% of electricity generated via renewable resources at these location
We now purchase credits equal to 50% of our total electricity usage, and we are looking to increase our future investment in this program.
Mix of natural gas, hydroelectric, wind and solar
Opportunity for greater investment
| 2013 | 2014 | 2015 | |
|---|---|---|---|
| Total Greenhouse gas emissions (metric tonnes CO2e, corresponds with Scopes 1, 2, and 3) | 15,966 | 17,501 | 17,256 |
| Greenhouse gas emissions (metric tonnes CO2e) (corresponds with Scopes 1 and 2) | 7,528 | 7,647 | 6,802 |
| Scope 1 GHG emissions (metric tonnes CO2e) by building type | 379 | 348 | 383 |
| By building type | |||
| Headquarters | 372 | 343 | 373 |
| Data Center | 8 | 5 | 10 |
| By region | |||
| California | 269 | 236 | 270 |
| Pennsylvania | 95 | 90 | 92 |
| Georgia | 5 | 4 | 6 |
| Other | 10 | 18 | 15 |
| By source | |||
| Natural gas | 364 | 338 | 363 |
| Diesel Fuel | 15 | 11 | 20 |
| Scope 2 GHG emissions (metric tonnes CO2e) | 7,148 | 7,299 | 6,419 |
| By building type | |||
| Headquarters | 5,676 | 5,780 | 4,989 |
| Data Center | 1,472 | 1,518 | 1,431 |
| By region | |||
| California | 3,577 | 3,500 | 2,787 |
| Pennsylvania | 1,652 | 1,668 | 1,466 |
| Georgia | 1,832 | 2,033 | 2,073 |
| Other | 88 | 97 | 93 |
| By source | |||
| Purchased electricity for operations | 7,148 | 7,299 | 6,419 |
| Scope 3 GHG emissions (metric tonnes CO2e) | 8,439 | 9,853 | 10,454 |
| By source | |||
| Auto Commute | 7,473 | 8,591 | 9,126 |
| Public Transit Commute | 205 | 247 | 313 |
| Business Travel | 760 | 1,015 | 1,015 |
Our enterprise companies comprise one of the nation’s largest dental benefit delivery systems, with 34.5 million enrollees.
To advance sustainability through innovative, ongoing operational initiatives and programs.
Using a supported browser?
Be sure JavaScript is enabled in your browser settings.